Photo by Frédéric Soltan/Corbis via Getty Images
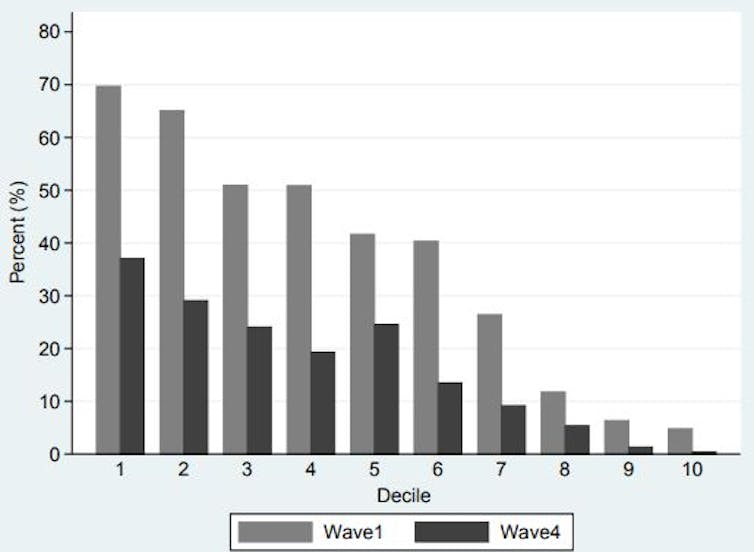
An analysis of financial inclusion in South Africa shows that affordability limits poor households’ access to formal financial services. In our study, which looked at people’s use of financial goods and services between 2008 and 2015, we found that there was a general increase in use. But this was severely skewed to households with higher incomes.
Financial inclusion is broadly defined as the ability of people to access a range of affordable financial services. Among these are bank and savings accounts, loans and insurance products. Households that are financially excluded can’t take part in various forms of savings or wealth accumulation. These range from paying bills via direct debit to gaining favourable forms of credit.
The key policy implication of our findings is that more financial services should target low-income households. It should be a priority, given the high rate of exclusion among the poor.
Measuring use based on income
In general, there are four dimensions of financial inclusion: access, usage, quality and welfare. In our study, we focus on usage.
The financial services available in South Africa range from the well-known ones such as bank accounts and credit cards to the less well known ones such as hire purchase agreements and loans with “mashonisa” (loan sharks). In the South African context, a bank account remains the most used financial service. The number of unbanked adult individuals decreased from 17 million to 14 million between 2003 and 2017.
Our study is the first to thoroughly investigate the data from the National Income Dynamics Study. This study interviews the same households (if possible) every two years to track the changes in their income and non-income welfare over time.
One standout feature of the study is that it asks household heads about their usage of 14 financial services.
With the aid of some statistical techniques, we developed an aggregate financial usage index to investigate the profile of people who were comprehensively financially included.
What we found
The study found that the increased use of financial products and services was mostly associated with higher income households. The other characteristics of individuals and households that showed higher usage of financial services were: middle-aged, male, white, more educated, urban residents in Western Cape and Gauteng provinces. They came from bigger households with more employed members.
The likelihood of complete financial exclusion was more prevalent in poor rural households living in the Eastern Cape, KwaZulu-Natal and Limpopo provinces. Almost invariably, these households were made up of black people. The study also found that households with low real per capita income and fewer employed members were associated with greater likelihood of financial exclusion. Households bigger in size and headed by middle-aged people were associated with significantly higher financial inclusion and lower likelihood of complete financial exclusion.
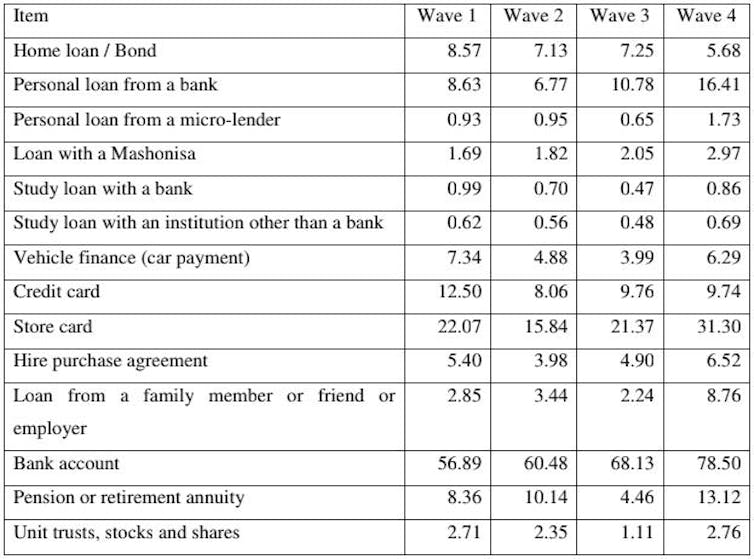
The table below presents the proportion of households with at least one adult member having some form of the observed financial services. The results indicate that there has been an increase in the use of most financial services between waves 1 (2008) and 4 (2014/2015). In particular, the proportion of households that have at least one member with a bank account increased from almost 57% in wave 1 (2008) to over 78% by wave 4 (2014/2015), while those with a personal loan from a bank nearly doubled (8.63% to 16.41%) between the first (2008) and last waves (2014/2015).

Author supplied
We also considered variables from informal financial sources, such as loans from mashonisa (loan sharks), which have increased from 1.69% in wave 1 to 2.97% in wave 4, and loans from a family member, friend or employer, which increased from less than 2.85% to 8.76%. The use of other important services, such as hire purchase agreements, store cards and pension or retirement annuity plans, also increased across the four waves. There is a decrease in the use of some of the major financial services. For example, households where at least one member reported to have a home loan or bond were at 8.63% in wave 1 and gradually declined over the years, ending up at 5.68% by wave 4. There was also a slight decline in study loans and vehicle finance.
One finance source that particularly stands out is the use of credit cards, which decreased from 12.5% (wave 1) to 9.74% (wave 4).
In all four waves, households that were regarded as poor had relatively lower rates of use of each source of finance.

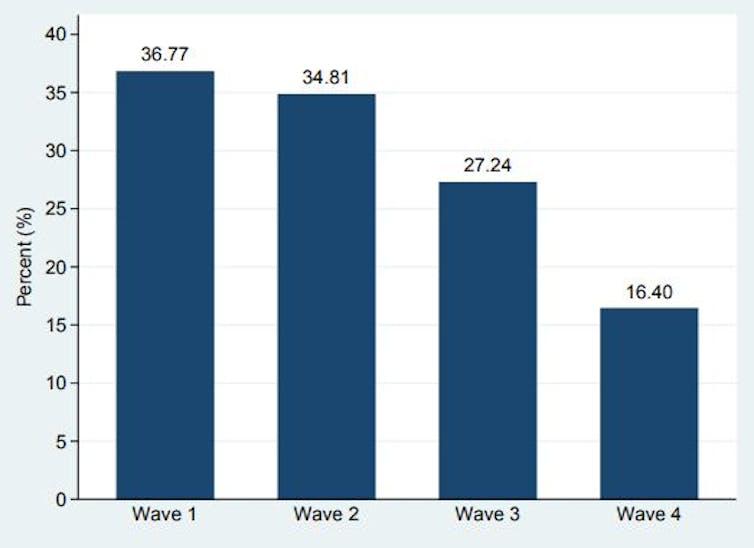
The figure below shows the proportion of households that were completely financially excluded (they didn’t have any of the 14 sources of finance). It more than halved between the first (36.77%) and fourth (16.40%) waves.

What next?
Supporting alternative, black finance access and usage is one possibility. This may range from low-cost bank accounts and products to advanced technologies that deliver financial services to the excluded in a swift, affordable and efficient manner.
Other countries can be used as a case study.
For instance, in India, the government and private providers have worked together to grow access to financial products such as insurance at a lower cost. The Indian government founded a social security fund that finances insurance companies to subsidise insurance premium policies offered to poorer households. This initiative has provided over two million poor Indians with access to insurance policies.
The promotion of money pools is also another option. A study conducted from five Caribbean countries showed that money pools, where poor people pool their money and create collective banks, helped people save. In Cameroon, the practice of lending and saving through kinship and financial networks was found to be more trusted than the mainstream.
This clearly calls for a proactive financial system that promotes such channels and one that is trusted by the general public, especially low-income earners.
But financial inclusion initiatives directed at the poor should be closely monitored. This is because they don’t always have a positive impact, particularly on poor people.
![]()
The authors do not work for, consult, own shares in or receive funding from any company or organisation that would benefit from this article, and have disclosed no relevant affiliations beyond their academic appointment.


