While Donald Trump’s positive test for COVID-19 provoked volatility on US stock markets, they remain only a few percentage points down from the all-time highs reached in early September.
After a crash in March caused by the pandemic, major US stock markets such as the Dow Jones, S&P 500 and the Nasdaq recovered rapidly. From mid-March to the end of August, the Standard & Poor index, which measures the stock prices of 500 large companies listed on US exchanges, rose by 60%. There has been some correction during September, but nothing dramatic.
During his presidency, Trump has frequently tweeted about the performance of the stock markets, citing it as proof of his achievement in increasing growth and prosperity in the US economy. He leads his Democratic presidential rival Joe Biden in polls about who would most effectively manage the economy. During the first televised presidential debate on September 29, Trump stated: “When the stock market goes up it means jobs and 401ks”, referring to American retirement plans.
But are US presidents actually rewarded for a rising stock market? A close look at the relationship between the stock market and presidential approval ratings over a 20-year period casts doubt on the idea that a rising market is good for an incumbent president.
Markets under Bush, Obama and Trump
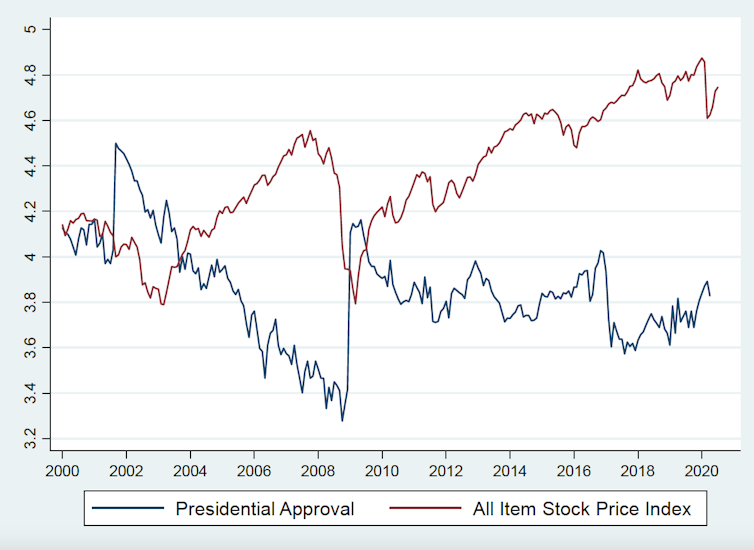
The graph below compares monthly observations of presidential approval with changes in the All Item Stock Price Index. This is the broadest measure of stock market performance available and it runs from July 2000 to July 2020. It shows that presidential approval ratings declined rather sharply under George W Bush at a time when the US stock markets were rapidly rising.

Author provided
Approval ratings then received a big boost when Barack Obama was first elected in 2008, but this coincided with a period when stock prices crashed because of the financial crisis and subsequent recession. During the Obama years, the market rose quite sharply while the president’s approval ratings slowly declined.
When Trump was elected, the market fell rather sharply before recovering fairly rapidly. Stock prices then enjoyed a significant boom before taking a huge hit when the pandemic struck. But the “COVID crash” was temporary and the market has recovered yet again.
Overall, there is a strong negative correlation between the performance of the market and presidential approval over this 20-year period. This contradicts the idea that a bull market in stocks boosts presidential approval. This has been true for both Democratic and Republican presidents and so casts doubt on the political payoff an incumbent president can expect to get for claiming credit for rising markets.
Economic growth is different
This evidence is quite surprising, since there is a lot of research to show that when the US economy is improving or doing well, presidential approval increases and incumbents are very likely to be re-elected. Good examples are the 1984, 1996 and 2012 elections.
The US historian Alan Lichfield has been forecasting American elections for many years with a considerable degree of success. He’s caused a stir among academic forecasters with his prediction that Biden will win the 2020 contest by a large margin. With 270 electoral colleges votes need for victory, he forecasts that Biden will win 341 votes and Trump 197.
If this is correct, it will be a decisive win for the Democrats and a better performance than Obama achieved in 2012. An important measure in his model is the rate of economic growth at the state level, showing how prosperity is a key factor in influencing an incumbent’s re-election chances. Battered by the pandemic, state-level growth in the US has taken a serious hit since the start of the year.
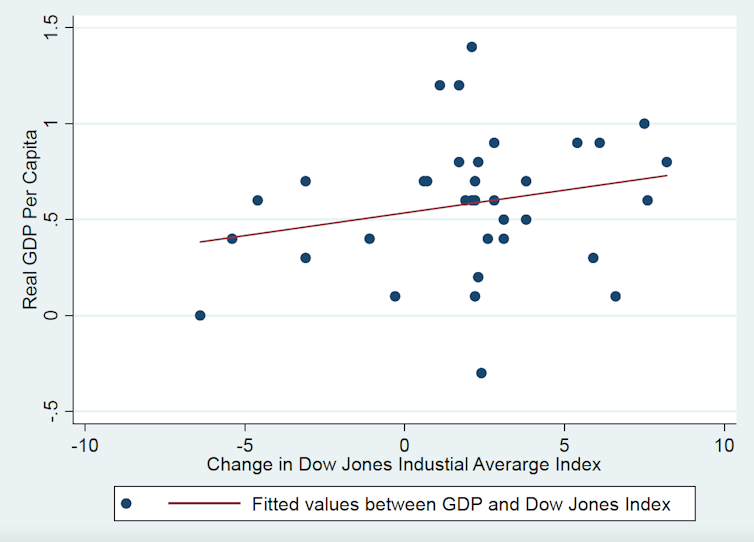
How is it that growth influences support for an incumbent president whereas the stock market appears to have the opposite effect? A clue to the answer lies in the chart below, which uses data supplied by the US Federal Reserve Economic Research Division. It shows the relationship between GDP growth per capita in the US economy and the performance of the Dow Jones Industrial Average over a period of nearly ten years, up to the end of 2019. Both measures take into account the effects of inflation.

Author provided., Author provided
If growth and stock prices were more closely related to each other, we would see a strong positive correlation between them, and the points on the graph above would tend to be very close to the line. However, the correlation between them is weak and statistically insignificant so the points are widely spread around the line. This is consistent with research which investigated the links between per capita GDP growth and real equity returns in 21 countries between 1900 to 2013. The researchers actually found a weak negative relationship between the two measures – meaning the fluctuation in a country’s stock market is actually largely unrelated to how well the real economy is performing.
This is a serious issue for the workings of contemporary capitalism. It means that the financial system has become decoupled from the real economy of growth, jobs and prosperity. But more to the point it explains why presidents are not likely to accumulate much political capital by touting rising markets.
When assessing presidential performance, American voters are guided by what is happening in the real economy. Main Street and Wall Street remain far apart in their minds.
![]()
Paul Whiteley receives funding from the British Academy and the Economic and Social Research Council.
Harold D Clarke has received funding from the National Science Foundation (U.S.)


