sladkozaponi / Shutterstock
The UK government’s most recent poverty statistics show that poverty rates declined during the first year of the pandemic. But this should offer little comfort to those concerned about the cost of living crisis.
The publication of these figures continues a longstanding trend of official poverty statistics being out of step with the dramatic socioeconomic upheavals affecting lowest income households the most. In part, this is because official poverty figures lag more than a year behind the current situation.
The main problem, though, is that the government’s primary measure of poverty is set at a threshold of 60% below median incomes. In practice, anchoring poverty measures to the resources of those in the middle tells us more about what’s going on for average earners than it does about the living standards of those towards the very bottom. To fully understand low-income dynamics and the effectiveness of policy interventions, we need to look beyond the overall numbers below a given threshold and look at how far people are actually falling below the poverty line.
In recent years, research analysts and anti-poverty campaigners have become increasingly concerned about the changing severity of financial hardship in high-income countries. But there is little consensus on how to measure or address it.
How deep does poverty go?
In the UK, there are at least five measures of deep poverty currently in circulation. Independent organisations such as the Social Metrics Commission, Joseph Rowntree Foundation and Child Poverty Action Group have all adopted slightly different indicators. These capture varying degrees of hardship, with the typical incomes of those in deep poverty changing considerably depending on the measure chosen.
The average disposable income (after housing costs) of someone in poverty, according to the government’s main measure, is around £11,300 a year. But it can be as low as £5,800 a year for someone falling more than 50% below the poverty line. Two people with these respective incomes would both be categorised as “in poverty”, but the nature and severity of the hardship they experience would be radically different.
Depending on the measure chosen, different people are also more likely to be affected. Single people without children and younger adults are both heavily over-represented among those experiencing the deepest forms of poverty, highlighting where policy interventions could help reduce severe hardship most effectively.
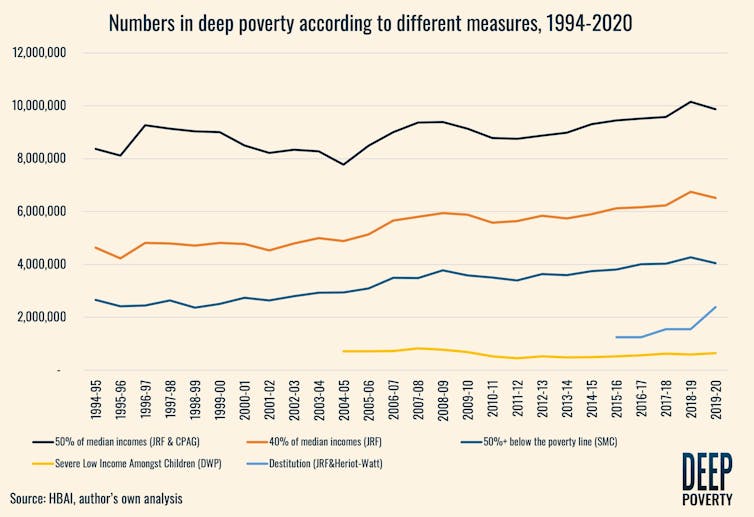
However you choose to measure it, deep poverty has increased considerably over the last 25 years. Since the mid-1990s, the number of people falling below the poverty line in the UK has increased by 8%. But the number falling more than 50% below this line has jumped by 53% (from 2.6 to 4.1 million people). Over the last decade, those closer to the poverty line have seen their relative incomes improve, while the poorest have seen their incomes fall the furthest. Women, children, larger families and black people are some of the worst affected by this trend.

Calculations based on Households Below Average Income statistics., Author provided
One-size-fits-all approach ignores poverty depth
Despite widespread calls to improve reporting on low incomes, the UK government recently announced that it was cancelling the development of a “wider measurement framework covering depth, persistence and lived experience of poverty”. This will also make it harder to target resources where they are most urgently needed in a cost of living crisis.
In the UK, public spending on social security has steadily grown, reaching around 12% of GDP last year. The fact that this has occurred alongside an increasing depth of poverty underlines a central contradiction of the UK welfare state. As a liberal welfare regime, centred on lower levels of state intervention, the UK is supposed to be focused on a more targeted, means-tested social security ideal – concerned much less with redistribution and more with poverty alleviation for those on low incomes.
However, the UK’s social security system is failing to protect the livelihoods of those who already have the least. Food insecurity, debts and financial strain are widespread among people who claim benefits. That said, the temporary £20 uplift to universal credit and working tax credit was particularly effective in helping some of the lowest income households weather the storm during the pandemic.
Those in deep poverty were most likely to be negatively affected by income or job loss during the pandemic. And new evidence suggests their drop in original income was partially offset by measures such as the £20 uplift.
The ongoing cost of living crisis stands to affect the lowest income households most. Despite this, new policy measures announced (or a lack thereof) in the spring statement last month are poorly targeted, with only £1 in every £3 going to those in the bottom half of the income distribution.
The pandemic showed that a boost to targeted, working-age benefits can make a big difference. If the government does not learn those lessons and introduce policies to support those on the lowest incomes, poverty will deepen for those who already have the least.
![]()
Daniel Edmiston receives funding from the British Academy and the Wolfson Foundation


